Did you know?
Visual data gets processed by brain 60,000 times faster than plain text and numbers. According to a famous Danish physicist Tor Norretranders, sense of sight has the highest bandwidth than other sensory stimuli like smell, sound, touch et al. Explains why graphs, charts and pictorial info graphic reign over numbers and plain text.
Data Visualization in IoT
IoT deployments in enterprises generate volumes of data from multiple systems. This data holds tons of insightful information useful for operations as well as strategic teams. However, raw data from devices is cumbersome and complicated to comprehend.
Organizations following traditional data storage and interpretation methods are finding it hard to retrieve critical information and derive actual value out of all the data aggregated. Excel sheets tend to get tedious and also pose possibilities for human errors. This is why most organizations are adopting into advanced data interpretation methods.
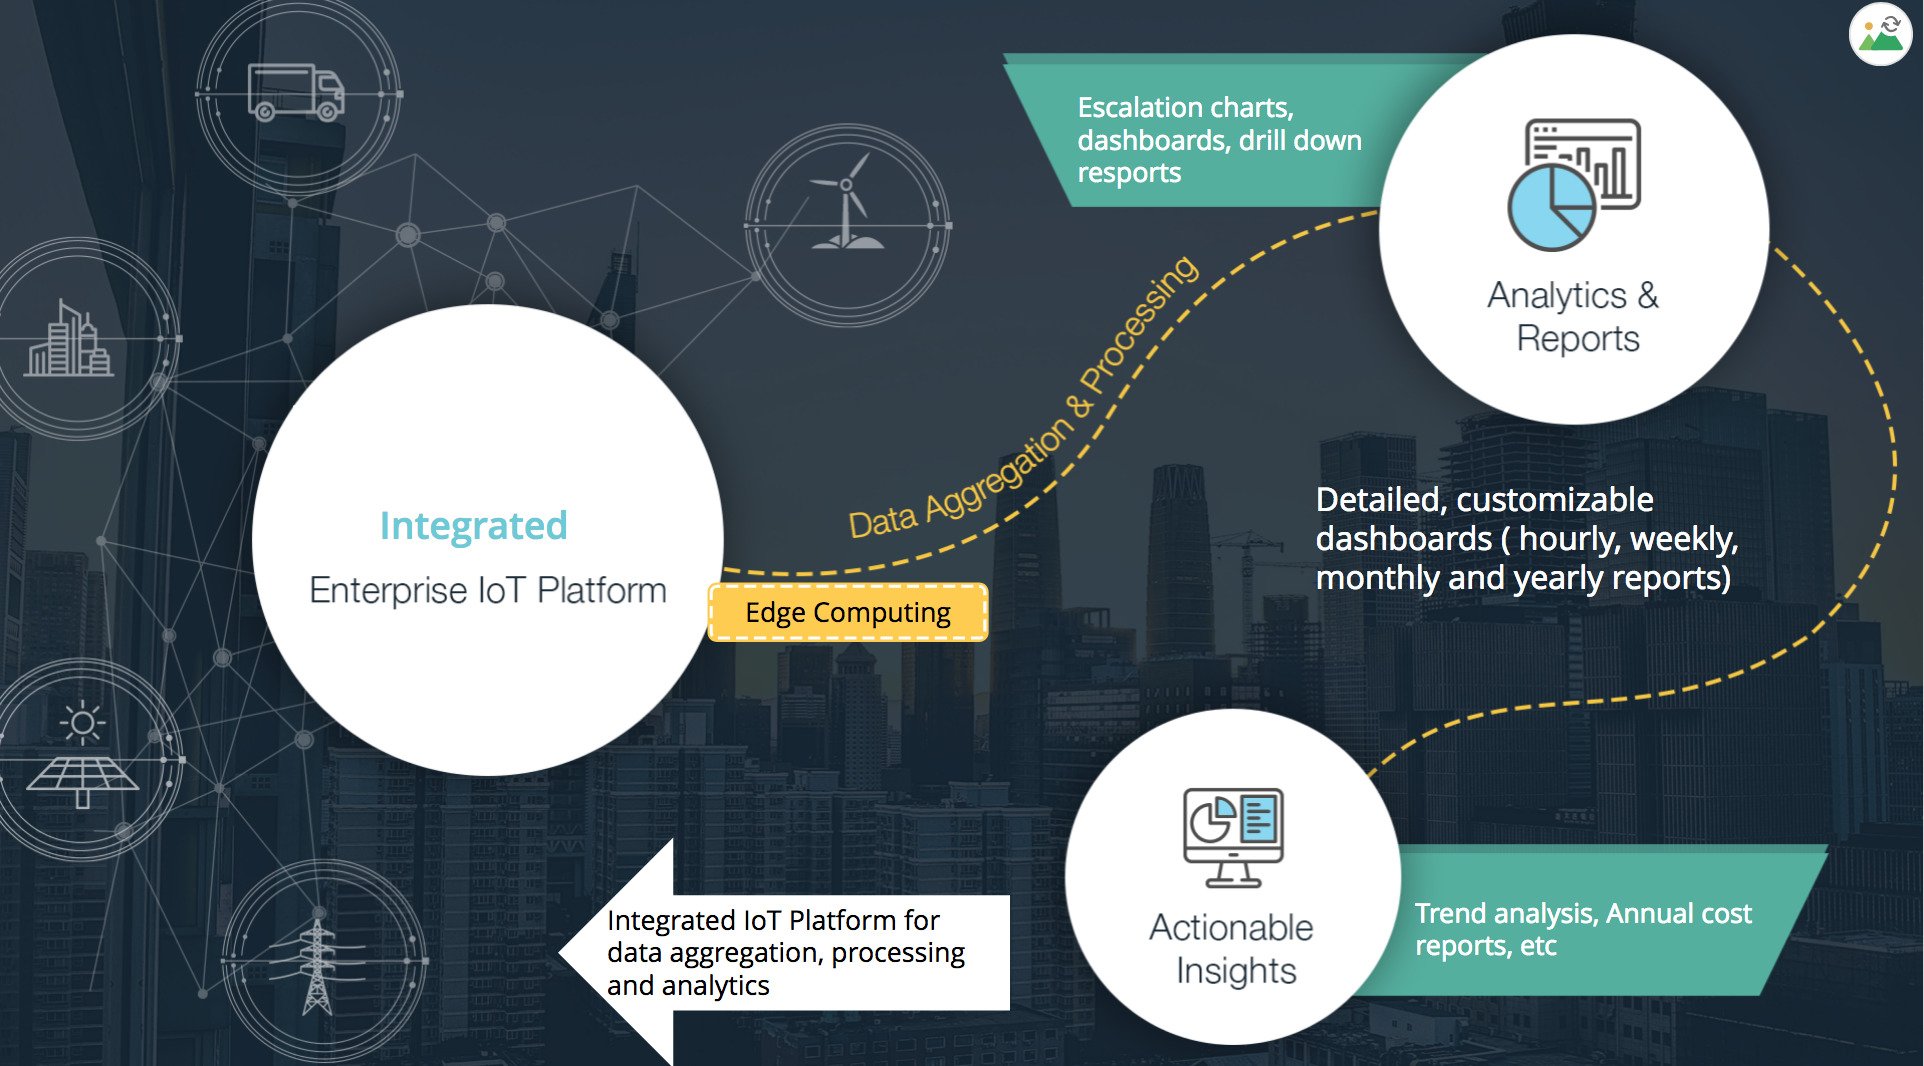
A purview of how data circulates in a tightly integrated enterprise IoT framework
Transforming incessant spreadsheets into clear and concise dashboards
Picture this. The following are energy monitoring data from multiple devices, collected in an excel worksheet for one particular day. Now imagine collecting volumes of raw data in spreadsheet format for a year. The scenario tends to get even more complex when millions of devices are connected and there is no defined strategy or tool to segregate all that valuable data.

Data in Excel
Now let’s find out how Data Visualization can add value to the management, technology leaders and operations teams by translating the raw numerals into pictorial format.

WebNMS GUI
Firstly, the dashboards give a clear picture of data incidents, and detailed analysis of operations which otherwise the user should have excavated from extensive excel sheets. Apart from giving operations teams vivid picture of asset health, periodic maintenance schedules and deviance if any, analytics also gives out trend analysis and insightful reports which will empower strategic teams to make informed and data driven decisions.

WebNMS GUI

WebNMS GUI
Dashboards offer unified view of multiple, disparate systems and prove to be beneficial in managing a portfolio for customers with multiple assets. Visual tools are a great way to capture, comprehend and communicate information across the organization. Data interpretation and analytics not only give out actionable insights but also help in improving efficiency through trend analysis and comparison charts.
By analyzing hidden patterns and trend reports from IoT data analytics its easier to make strategic decisions that drive revenue growth and improve the bottom line over the period.

WebNMS IoT Platform and Data Visualization
In order to achieve seamless data aggregation, processing and analytics it is important to have an IoT platform that is features rich and offer end to end application enablement. Very few IoT platforms can acquire, store and process data and render actionable intelligence in a seamless manner.
WebNMS offers one such IoT platform. It is a tightly integrated IoT platform that empowers rapid data aggregation, analytics and insights through an intuitive and customizable User Interface.
WebNMS Visualization Platform Highlights
- Customizable Dashboards
- Role based view
- Daily, monthly and annual charts
- Trend analysis and periodic insight generation
- Individual alarm charts
- Single console view
- Region wise reports
- Granular asset view
- Filtering
- Comparative insights
- Machine Learning
- Web and mobile GUI

The reports offer detailed, drilled down view of assets and sites managed and annual operational expenses and periodic trend analysis.
If you are looking for an IoT platform to build customized solutions for data driven enterprise operations, get in touch with our BD team. Write to ioteval@webnms.com or visit www.webnms.com to download free trial of the software.
For further info on Data visualization in IoT, view our detailed webinar presentation in this link: http://bit.ly/2PRnwyu